We are pleased to present this rich guest post by a new PEF member, Edgardo Sepulveda. Edgardo has been a consulting economist for more than two decades advising Governments and operators in more than 40 countries on telecommunications policy and regulation matters (www.esepulveda.com).
Redistribution, Inequality and the new Federal Tax & Transfer initiatives
I want to present an analysis of Canada’s taxation and transfers system from a historical and international perspective, focussing on how changes in Canada’s fiscal redistribution over the last two decades have increased after tax income inequality. I also situate three of the new Federal Government’s proposed initiatives: the “middle class tax cut” (“MCTC”), the new Canada Child Benefit (“CCB”); and increases to GIS benefits in this broader context. This work brings together several elements that have been discussed here and in other research, and updates the analysis based on recently-released internationally-comparable data from the OECD.
Analysis
Figure 1 presents “market” and “after tax” income Gini coefficients for Canada and the OECD. Market income is before taxes and government cash transfers, while after tax income is after taxes and transfers. The Gini coefficient varies from 0 to 1.00, with higher values representing higher inequality. For comparative purposes, I include the “OECD-14” (representing the 14 OECD Member-Countries for which Gini coefficients are available from the mid-1980s) average, as well as the traditional inequality/taxation revenue “book-ends”: the USA and the four larger Nordic countries (“Nordics-4”: Denmark, Finland, Norway and Sweden).
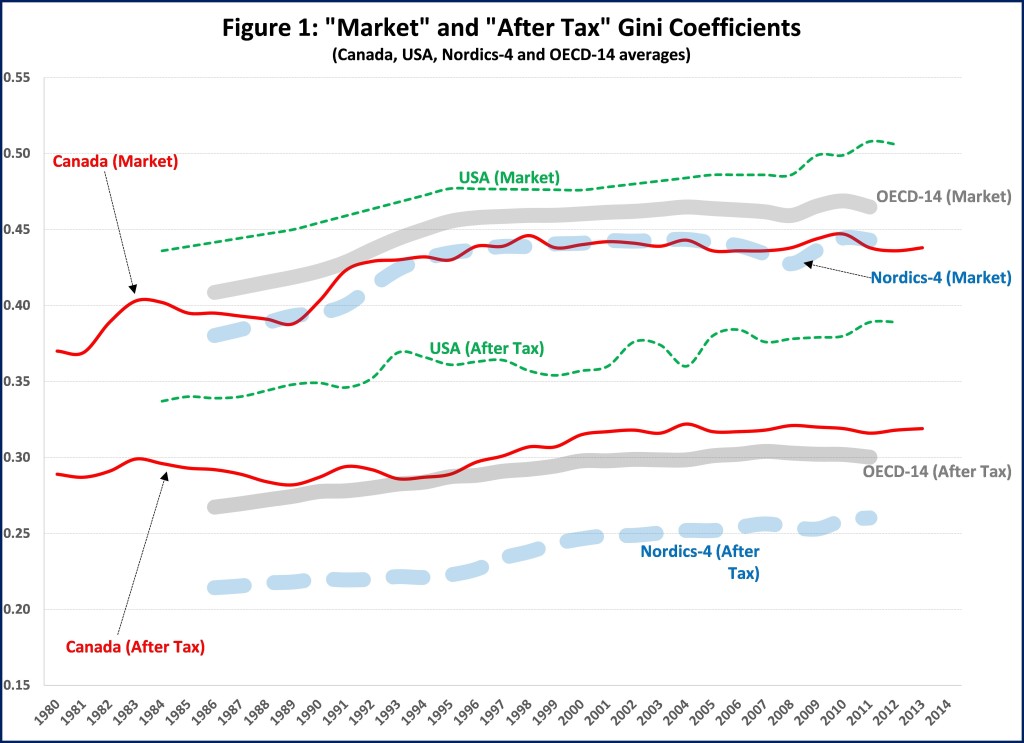
Figure 1 shows that market income inequality generally increased relatively quickly until the mid-1990s, after which it slowed down or stabilized across the OECD-14. Canada’s market inequality is below the OECD-14, similar to that of the Nordics-4 and lower than the USA. Governments redistribute income via the tax and transfer systems (“fiscal redistribution” or “redistribution”) and hence after tax income Gini coefficients are always lower than the respective market income Gini coefficients.
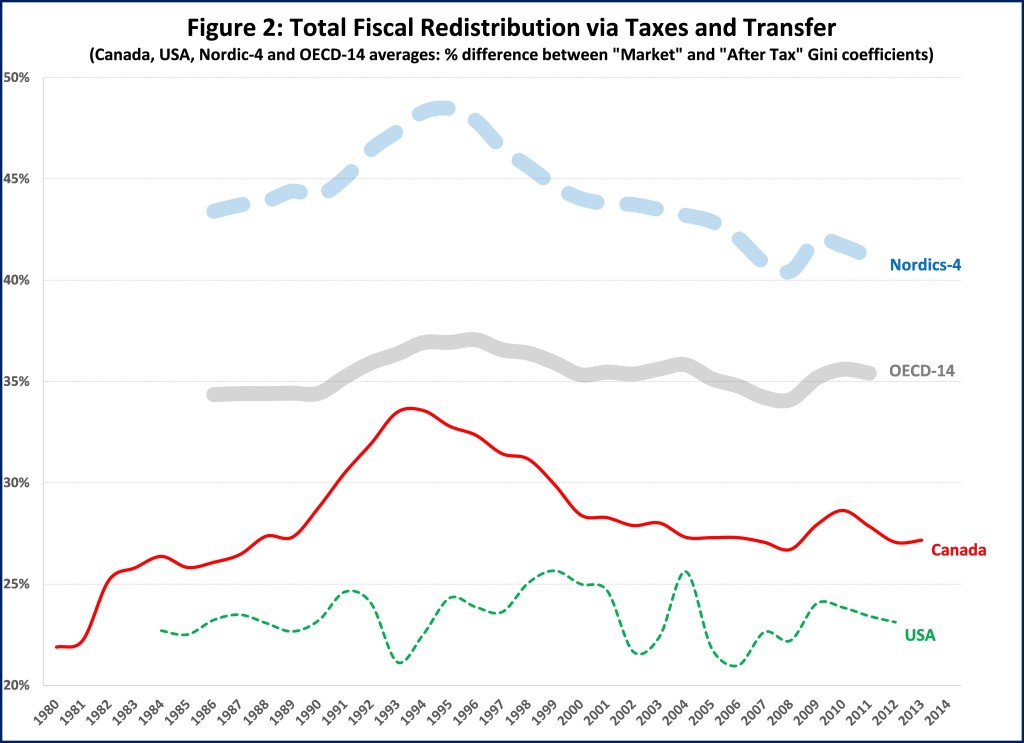
Fiscal redistribution varies significantly across time and countries. For example, Canada has historically had lower market inequality than the OECD-14, but has historically had higher after tax inequality. Similarly, Canada has had market inequality comparable to the Nordics-4, but has historically had much higher after tax inequality. One way to measure redistribution is presented in Figure 2, which shows the percentage difference between market and after tax income Gini coefficients. For example, Canada’s figure of 34% for 1994 indicates that redistribution reduced market to after tax inequality from 0.432 to 0.287. Figure 2 confirms that Canada (currently at 27%) has traditionally had less redistribution than the OECD-14 (currently at 35%) and the Nordics-4 (currently at 41%) and that its redistribution has decreased since peaking in 1994. Redistribution in Canada has been closer to the USA (currently at 23%) for more than a decade.
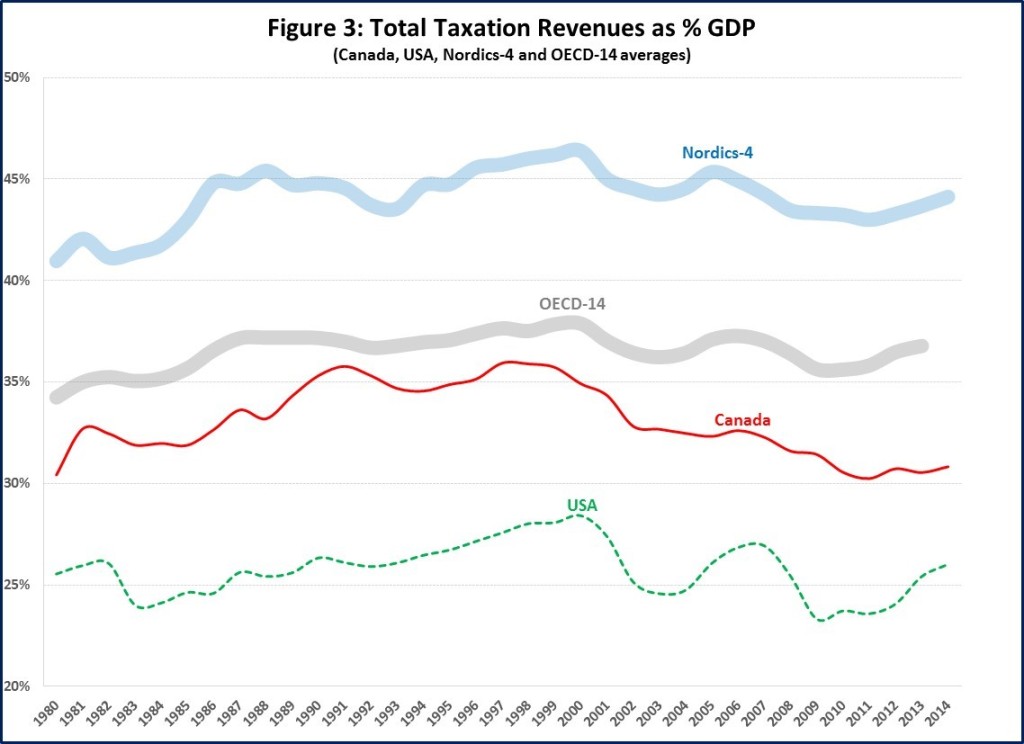
A country’s redistribution is a combination of its fiscal capacity and allocation of revenues and expenditures. Figure 3 presents total (“all Government”) taxation revenues as a percentage of GDP and shows a steady increase and subsequent stabilization until about the mid/late 1990s for Canada, the OECD-14 and the Nordics-4, at around 35%, 37% and 45%, respectively (the USA is an outlier at around 25%). Figure 3 shows that Canada’s taxation revenues to GDP started to decline in the late 1990’s so that by the 2010s Canada had stabilized at around 30%-31%; Canada is now closer to the USA than the OECD-14 and is at its lowest level since 1980.
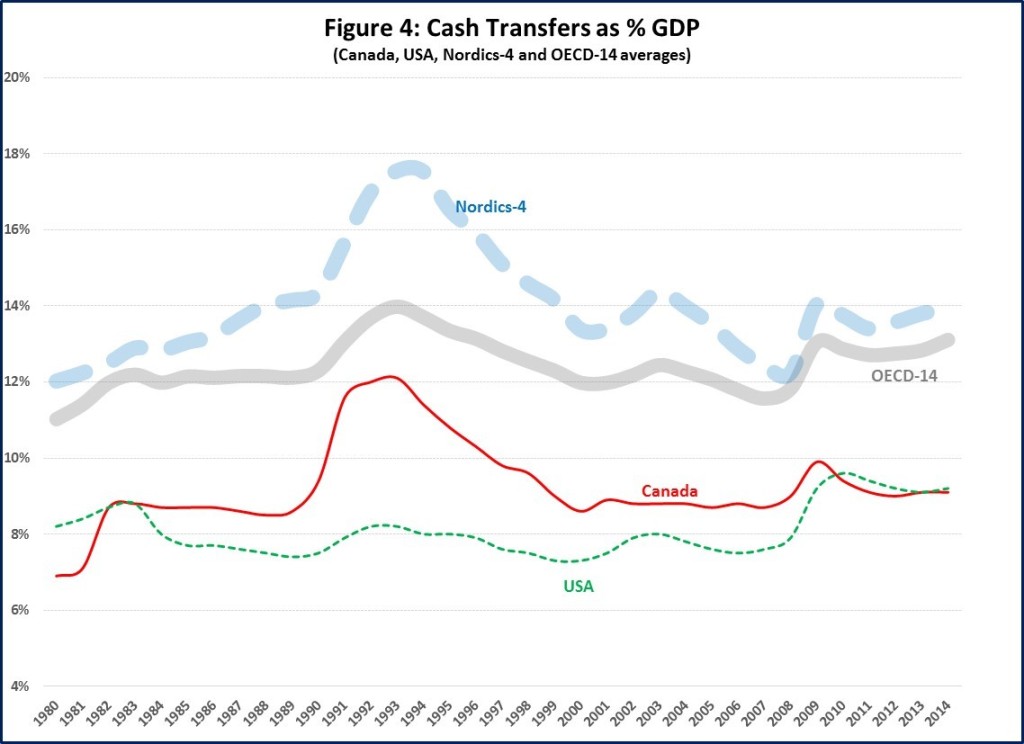
Research has shown that transfers have generally accounted for about two-thirds of the redistributive impact, with taxes accounting for the other third. Personal income tax (PIT) revenues to GDP in Canada have been historically similar to those in the OECD-14, and hence cannot explain the differences in redistribution. In fact, Figure 4 shows that these differences are due to transfers; Canada has historically had lower transfers to GDP than the OECD-14. Since 1980, the OECD-14 have on average allocated 34% of total taxation revenues to transfers, while Canada has averaged 28%. Taken together, Canada’s relatively low and decreasing taxation revenues to GDP and its low allocation to transfers have led to comparatively low and decreasing transfers, resulting in low and, and since 1994, decreasing redistribution.
The next two figures separate the effect of taxes and transfers on redistribution since it peaked in 1994. This more disaggregate analysis is possible for Canada because Statistics Canada also makes available the “total” income Gini coefficient (not available from the OECD), which is the market income plus transfers, but before taxes.
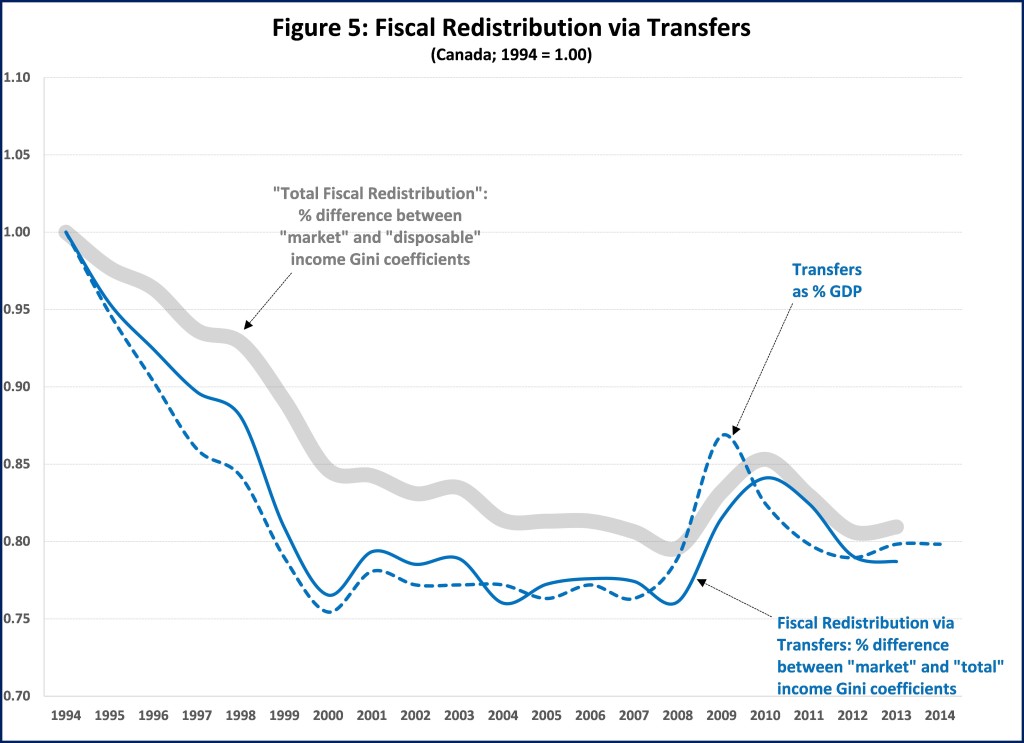
For Canada, Figure 5 brings together the changes in transfers to GDP with the transfers component of redistribution. Figure 5 also includes total redistribution (all numbers indexed to 1.00 in 1994). Figure 5 shows that transfers to GDP and transfers redistribution are closely correlated and have stabilized at between 20%-25% below the 1994 peak: decreased transfers lead to less redistribution. Transfers redistribution decreased more than total redistribution. The redistributive impact of any fiscal variable may be disaggregated between the size and the progressivity of the variable. The close relationship between transfers and transfers redistribution suggests that it is primarily the size of transfers that has changed since 1994 (with only modest changes in progressivity). In effect, other research indicates that the main drivers of this overall reduction were decreases in the “size” of provincial social assistance (SA) and federal Employment Insurance (EI) relative to GDP.
Figure 6 presents the equivalent data for the taxation component and shows that both PIT revenues to GDP and the tax redistribution increased from 1994 to 1999 (higher taxes led to greater redistribution), after which they generally decreased (lower taxes led to less redistribution). Figure 6 shows a relatively close relationship between the two variables over the 1994-1999 period, but less so during the 2000-2014 period, with PIT decreases not resulting in commensurate increases in inequality, suggesting that the progressivity of PIT increased somewhat during this period.

Discussion
Canada’s tax and transfers have historically provided less fiscal redistribution than almost all our OECD-14 counterparts. Most of the difference in this performance is due to Canada’s low and declining transfers, which together with lower personal income taxes, has led to higher after tax income inequality in Canada over the last two decades. This is in spite of underlying market income inequality being relatively stable over this period. In almost all these respects Canada has diverged from the OECD-14 and converged to the USA over the last two decades.
Such changes in fiscal redistribution are policy-induced and therefore subject to change. I have shown that other OECD-14 counterparts have achieved and maintained much higher redistribution and lower after tax income inequality.
This analysis identifies a number of broad policy options to increase redistribution, which I also use to situate and discuss the new Federal Government’s three proposed initiatives.
· One policy option is to increase the progressivity of taxes and/or transfers. The MCTC is a good example of this, in that it re-allocates about $3 billion of PIT around the upper income distribution while (more or less) being “revenue neutral”. The MCTC is therefore modestly progressive but its relative “size” is very modest (accounting for less than 2% of PIT revenues), so I expect its redistributive impact will be very modest.
· A second policy option is to increase the size of taxes and/or transfers. The increase of about $0.7 billion in GIS benefits is a good example of this. This proposed initiative may be expected to be relatively progressive, but its relative size is very modest (accounting for less than 1% of Government cash transfers), so its redistributive impact will also be very modest.
· A third policy option is to combine an increase in the size and progressivity of taxes and/or transfers. The new CCB is a good example of this because it eliminates three existing child benefits (about $18 billion + $2 billion from income splitting elimination) and combines them into a new $22 billion CCB (with an additional $2 billion) (therefore a net increase of $4 billion), that is designed to be somewhat more progressive. I expect that the CCB will have a modest redistributive impact.
All three Federal Government initiatives will increase redistribution and will therefore reduce after tax income inequality. As possible future work I may try to model the redistributive impact of these three initiatives. Based on the analysis above and other research, my current “back of the envelope” estimate is that, ceteris paribus, when fully implemented, the combined redistributive impact of the three initiatives would decrease Canada’s after tax Gini coefficient by perhaps up to 0.005 points and thus increase Canada’s redistribution perhaps by one percentage point – that is, from the current 27% to perhaps about 28%. These initiatives are therefore relatively very modest and would constitute only first steps in a long process towards returning Canada’s redistribution to prior levels (peak of 34%) or those that are comparable to most of our OECD-14 counterparts (currently at 35%), let alone the Nordics-4 (currently at 41%).
Of course, given Canada’s system of fiscal federalism, the Provinces would also have to do their part. The Provinces together collect PIT revenues that are comparable to those of the Federal Government, receive transfer payment from the Federal Government intended for social programs (the Canada Social Transfer (CST)) and are also responsible for important transfers, including social assistance (SA); hence have both the fiscal capacity and the tools to increase redistribution. As noted above, the size of SA relative to GDP has decreased considerably since the mid-1990s. Using the same “back of the envelope” methodology, I estimate that for the Provinces to “match” the one percentage point redistribution increase from the Federal Government’s three initiatives, they would have to, for example, increase the “size” of SA by perhaps in the range of $5-$6 billion in total. Such an increase could be through some combination of broadening the eligibility criteria or increasing the amount of cash benefits.